Keep it simple, stupid
Data-driven game development is the key to all successful games. However, the flood of data can feel overwhelming at times. This guide will help you focus on the most essential KPIs and mobile game metrics along the funnel.
One primary metric at each step serves as an overview, while secondary metrics contextualize it. All together, you’ll create a holistic view of your users and how they behave.
Top 4 Mobile Game Metrics To Track
The goal of every game is to make money.. We divide the user journey into four key steps, each with one critical primary KPI:
- Acquisition
- Engagement
- Retention
- Monetization -> That’s where you make revenue
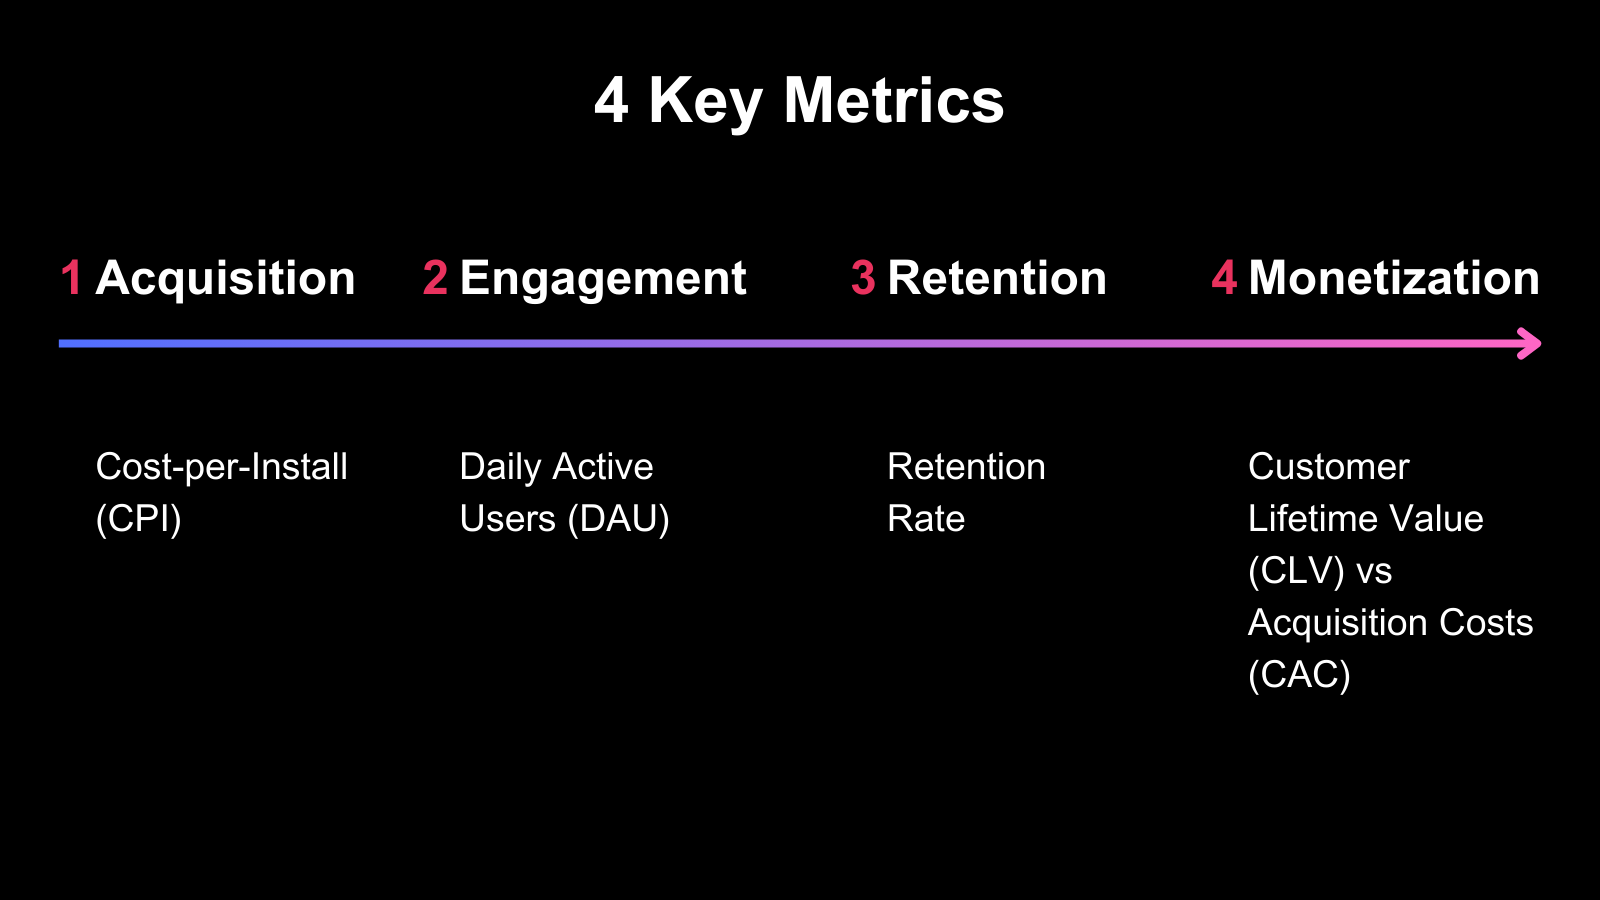
1. Acquisition
Primary Metric: Cost-per-Install (CPI)
CPI = ad spend / total number of downloads
First, you have to generate downloads for your game. But to make it a success, you have to already keep in mind your last step, monetization. How much money will the download generate?
To make a better guess, it’s helpful to segment users into different buckets based on your collected data. For example, are there differences based on gender, age, interests, device, marketing channel, or other factors that you can target in your advertising? This way, you can estimate your max CPI for that user segment, which is crucial when analyzing mobile game metrics.
For example, let’s say I have a ROAS (Return on ad spend) goal of 100% on first-time buys. The game will therefore make money with every consecutive buy a user does. User group A has an average first-time revenue of 30$ and the conversion rate from download to purchase is 10%. As a result, my max CPI for users in that group A is 3$.
How to optimize CPI?
This is where the secondary mobile game metrics come in. Your CPI depends on the CPM (Cost-per-Mille), the cost of one thousand impressions, the CTR (Clickthrough Rate), the number of clicks your ad receives divided by the number of impressions, and the install conversion rate.
While decreasing the CPM helps to bring down CPIs, it also limits your reach as you become less competitive compared to other advertisers. Therefore, it’s advisable to try to increase CTRs by testing different ad copies and creatives. The same applies to conversion rates throughout the funnel. Also, test multiple marketing channels and target different audiences to identify what works best for you.
While many advertising platforms offer you to bid a CPC (Cost-per-Click), CPL (Cost-per-Lead), or another bidding model, CPM remains a key secondary mobile game metric you have to keep an eye on. Publishers have a limited inventory of impressions and maximizing revenue means maximizing CPMs for them. If your CPM bids become too low, you’ll lose reach.
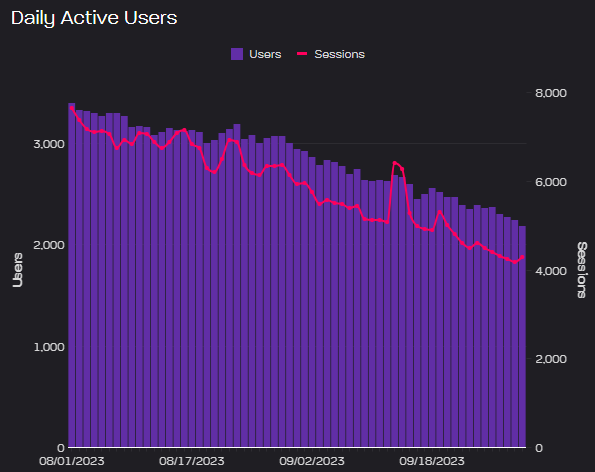
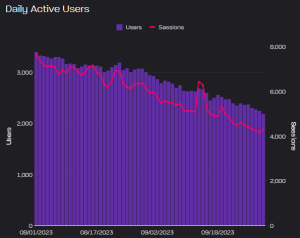
2. Engagement
Primary Metric: Daily Active Users (DAU)
How many people play your game on a given day?
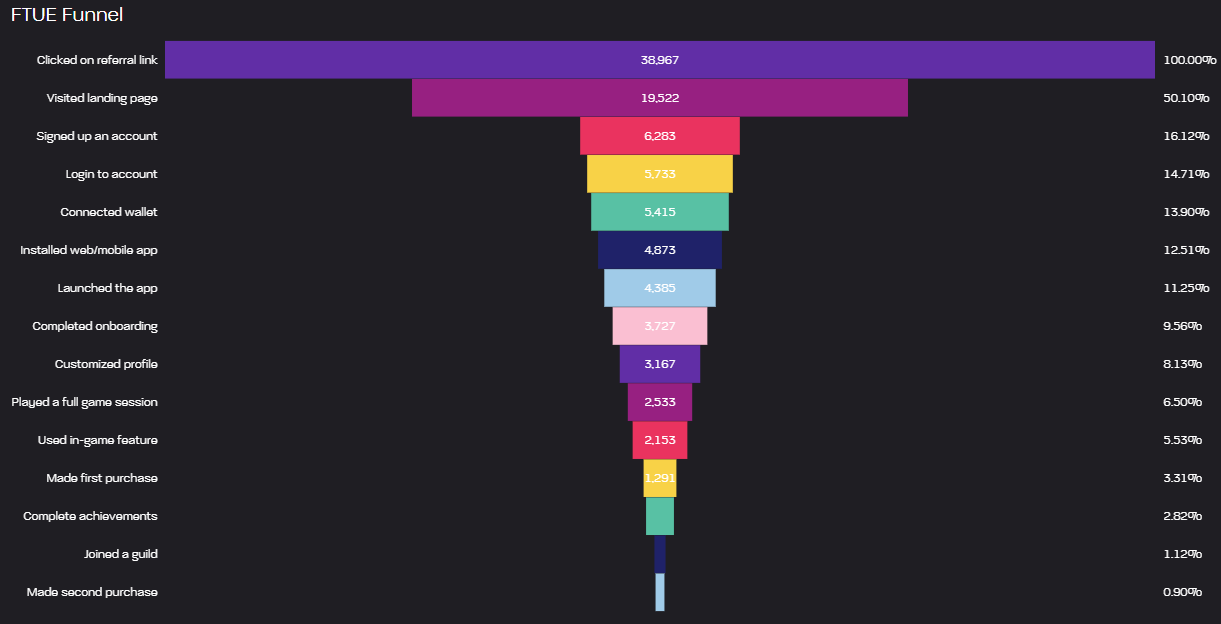
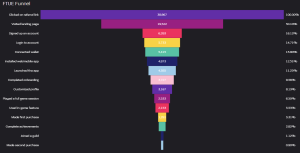
The next step after downloading a game is using it. As a secondary mobile game metric, track your activation rate (Percentage of downloads that launched the game). To keep users coming back after activation, the FTUE (First-Time User Experience) is crucial.
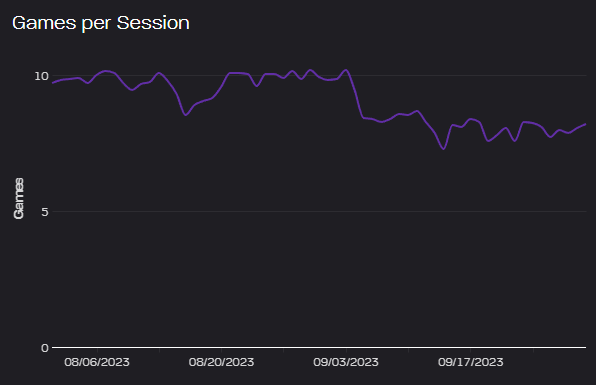
As users keep engaging, track the number of sessions and session length to measure how involved your users are. Another KPI is the DAU/MAU ratio (MAU = Monthly Active Users) which showcases the stickiness factor of your game.
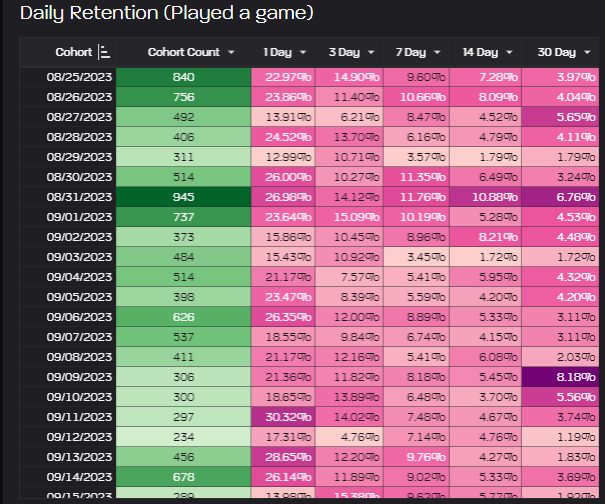
3. Retention
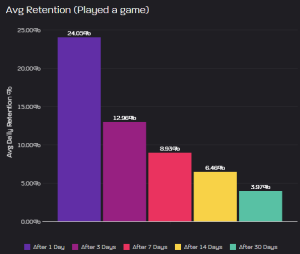
Primary Metric: Retention rate
Percentage of users who are active x days after using the game for the first time
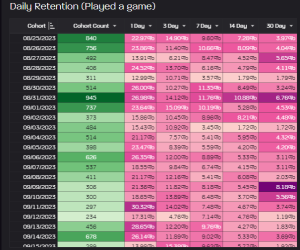
Retention is measured from short-term (3-day retention, 7-day), to mid-term (30-day, 90-day), and long-term (180-day and more). This creates a nice retention curve.
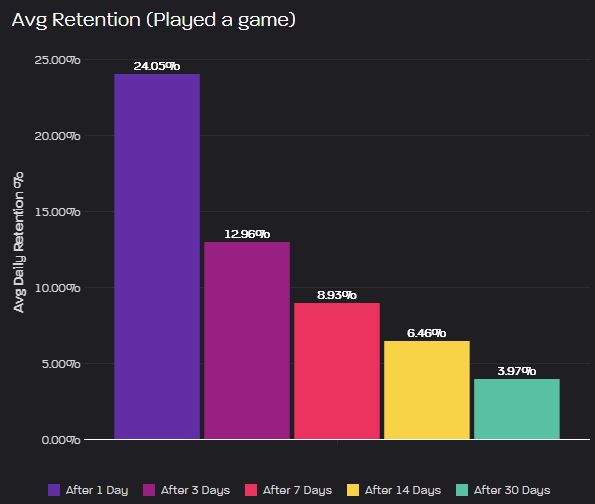
Retention is positively correlated to revenue. To optimize retention rates, divide users into cohorts based on the first time they launched the game. A/B test different mechanics to see how they impact user behavior.
For example, make use of personalized notifications to bring back users every day.
4. Monetization
Finally, we reach the stage of generating revenue.
Primary Metric: Customer Lifetime Value (CLV) vs Customer Acquisition Costs (CAC)
CLV = Value a customer brings in over their lifetime (revenue from purchases and referrals)
CAC = Costs to acquire and retain the customer along their lifetime
CLV curves give a better overview of how the value is distributed over time and when you can expect to break even on your CAC.
Segment your audience to estimate CLV curves more precisely and inform your marketing on how much can be spent on acquiring a specific user type.
Secondary metrics are:
ARPU (Average Revenue Per User)
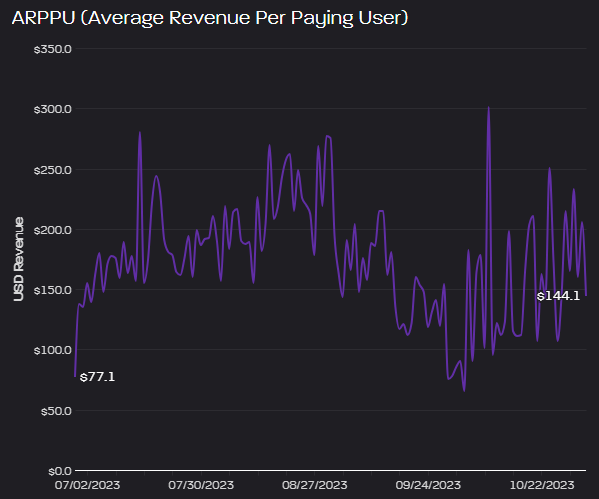
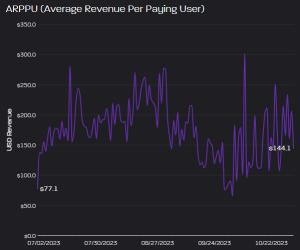
ARPPU (Average Revenue Per Paying User)
ARPDAU (Average Revenue Per Daily Active User).
Segmenting your audience helps estimate CLV and informs your marketing spend.
These help you get a quick overview of your average revenue per user and identify potential challenges in the funnel. For example, if ARPU is low but ARPPU is high, you should try to increase the conversion rate from free to paying users. If ARPDAU is high but revenue is low, the retention rate should be optimized.
Tips For Working With Metrics
Throughout the guide, we’ve recommended segmenting users into different groups to generate more detailed insights. Here, it’s important to keep in mind that data segmentation leads to smaller data sets. This puts a natural limit on how far data can be segmented, as the smaller the data set the harder it is to generate statistically significant learnings. Also, it’s always advisable to ask yourself if further segmentation is actionable. For example, if you can’t reach that specific group through ads, it’s not actionable.
Our second tip is to make use of moving averages to identify trends. Day-to-day metrics can fluctuate immensely based on different factors, many of which we have no influence on. Keep calm and focus on the trend. An immediate reaction is only needed if fluctuations are stronger than normal. For example, draw a range of two standard deviations up and down the average and set a trigger when a metric breaks that range.
Track Your Mobile Game Metrics With Helika
Helika is your one-stop shop for tracking mobile game metrics. Whether foundational in-game analytics, marketing attribution, or A/B testing, we help game studios build, grow, and optimize their games.
Keep it simple, stupid
Data-driven game development is the key to all successful games. However, the flood of data can feel overwhelming at times. This guide will help you focus on the most essential KPIs and mobile game metrics along the funnel.
One primary metric at each step serves as an overview, while secondary metrics contextualize it. All together, you’ll create a holistic view of your users and how they behave.
Top 4 Mobile Game Metrics To Track
The goal of every game is to make money.. We divide the user journey into four key steps, each with one critical primary KPI:
- Acquisition
- Engagement
- Retention
- Monetization -> That’s where you make revenue

1. Acquisition
Primary Metric: Cost-per-Install (CPI)
CPI = ad spend / total number of downloads
First, you have to generate downloads for your game. But to make it a success, you have to already keep in mind your last step, monetization. How much money will the download generate?
To make a better guess, it’s helpful to segment users into different buckets based on your collected data. For example, are there differences based on gender, age, interests, device, marketing channel, or other factors that you can target in your advertising? This way, you can estimate your max CPI for that user segment, which is crucial when analyzing mobile game metrics.
For example, let’s say I have a ROAS (Return on ad spend) goal of 100% on first-time buys. The game will therefore make money with every consecutive buy a user does. User group A has an average first-time revenue of 30$ and the conversion rate from download to purchase is 10%. As a result, my max CPI for users in that group A is 3$.
How to optimize CPI?
This is where the secondary mobile game metrics come in. Your CPI depends on the CPM (Cost-per-Mille), the cost of one thousand impressions, the CTR (Clickthrough Rate), the number of clicks your ad receives divided by the number of impressions, and the install conversion rate.
While decreasing the CPM helps to bring down CPIs, it also limits your reach as you become less competitive compared to other advertisers. Therefore, it’s advisable to try to increase CTRs by testing different ad copies and creatives. The same applies to conversion rates throughout the funnel. Also, test multiple marketing channels and target different audiences to identify what works best for you.
While many advertising platforms offer you to bid a CPC (Cost-per-Click), CPL (Cost-per-Lead), or another bidding model, CPM remains a key secondary mobile game metric you have to keep an eye on. Publishers have a limited inventory of impressions and maximizing revenue means maximizing CPMs for them. If your CPM bids become too low, you’ll lose reach.
2. Engagement
Primary Metric: Daily Active Users (DAU)
How many people play your game on a given day?
The next step after downloading a game is using it. As a secondary mobile game metric, track your activation rate (Percentage of downloads that launched the game). To keep users coming back after activation, the FTUE (First-Time User Experience) is crucial.
As users keep engaging, track the number of sessions and session length to measure how involved your users are. Another KPI is the DAU/MAU ratio (MAU = Monthly Active Users) which showcases the stickiness factor of your game.

3. Retention
Primary Metric: Retention rate
Percentage of users who are active x days after using the game for the first time
Retention is measured from short-term (3-day retention, 7-day), to mid-term (30-day, 90-day), and long-term (180-day and more). This creates a nice retention curve.
Retention is positively correlated to revenue. To optimize retention rates, divide users into cohorts based on the first time they launched the game. A/B test different mechanics to see how they impact user behavior.
For example, make use of personalized notifications to bring back users every day.
4. Monetization
Finally, we reach the stage of generating revenue.
Primary Metric: Customer Lifetime Value (CLV) vs Customer Acquisition Costs (CAC)
CLV = Value a customer brings in over their lifetime (revenue from purchases and referrals)
CAC = Costs to acquire and retain the customer along their lifetime
CLV curves give a better overview of how the value is distributed over time and when you can expect to break even on your CAC.
Segment your audience to estimate CLV curves more precisely and inform your marketing on how much can be spent on acquiring a specific user type.
Secondary metrics are:
ARPU (Average Revenue Per User)
ARPPU (Average Revenue Per Paying User)
ARPDAU (Average Revenue Per Daily Active User).
Segmenting your audience helps estimate CLV and informs your marketing spend.
These help you get a quick overview of your average revenue per user and identify potential challenges in the funnel. For example, if ARPU is low but ARPPU is high, you should try to increase the conversion rate from free to paying users. If ARPDAU is high but revenue is low, the retention rate should be optimized.
Tips For Working With Metrics
Throughout the guide, we’ve recommended segmenting users into different groups to generate more detailed insights. Here, it’s important to keep in mind that data segmentation leads to smaller data sets. This puts a natural limit on how far data can be segmented, as the smaller the data set the harder it is to generate statistically significant learnings. Also, it’s always advisable to ask yourself if further segmentation is actionable. For example, if you can’t reach that specific group through ads, it’s not actionable.
Our second tip is to make use of moving averages to identify trends. Day-to-day metrics can fluctuate immensely based on different factors, many of which we have no influence on. Keep calm and focus on the trend. An immediate reaction is only needed if fluctuations are stronger than normal. For example, draw a range of two standard deviations up and down the average and set a trigger when a metric breaks that range.
Track Your Mobile Game Metrics With Helika
Helika is your one-stop shop for tracking mobile game metrics. Whether foundational in-game analytics, marketing attribution, or A/B testing, we help game studios build, grow, and optimize their games.