
Heatmap analysis serves as a valuable tool for understanding user interactions within your game. With this collected data, you can identify areas of high user engagement, optimize your game design and improve the overall customer experience.
In this guide, we will discuss everything you need to know about heatmap analysis for player behavior. As the leading Web3 game analytics company, Helika has helped countless game developers and publishers make informed decisions through data analysis.
Visual Representation with Heatmap Data
Whether you’re a game developer trying to improve conversion rates or curious about your low engagement, heat map analysis can provide valuable insights into user activity. By visually seeing how far users go before rage clicks begin for example, you can pinpoint areas of frustration and make necessary changes to improve the user journey.
Heatmaps are graphical representations of data that use color-coding to show frequency or intensity levels. In essence, they provide a visual representation of users’ behavior, making it easier to analyze data compared to traditional numerical tables. They are an essential tool in A/B testing and website analysis as they enable you to identify actionable insights for your business.
Despite predictive analysis, a users’ behavior can be unpredictable. Heatmaps help you see what users truly do on your website or game, providing valuable insights into their actual behavior rather than just relying on quantitative data. Predictive analysis gives us a great starting point but heatmaps enable us to optimize in-app user behaviour ensuring that our UX is user-friendly and engaging.
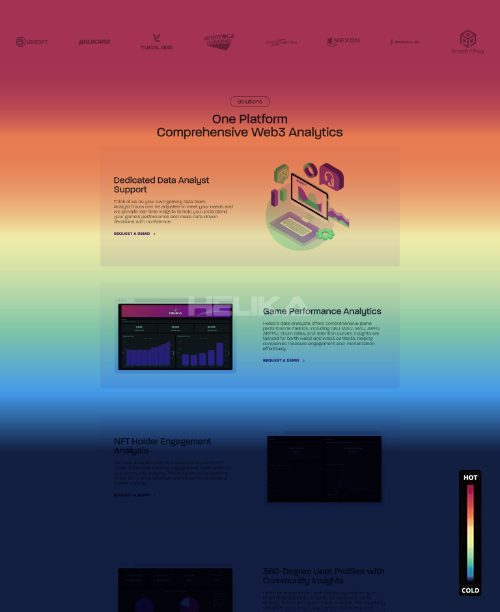
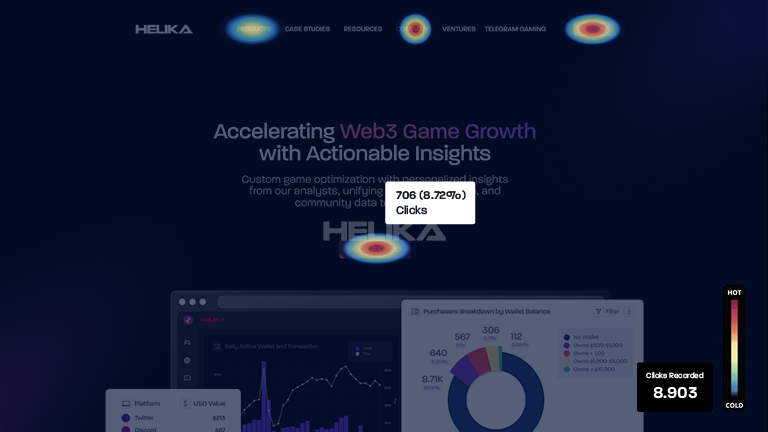
There are different ways heat maps can be used. As suggested earlier, the colored areas of the heat map represent frequency or intensity levels, with warmer colors indicating higher levels and cooler colors showing lower levels. You can use this information to:
- Identify popular areas: By seeing where users spend most of their time, you can optimize these sections for maximum engagement.
- Identify dead areas: Heatmaps can help you pinpoint areas users are not engaging with, allowing you to make changes or remove them entirely.
- Determine user flow: With heatmaps, you can see how users navigate through your website or game, identifying potential roadblocks and making necessary improvements.
- Understand click patterns: By tracking where users click the most and if they’re clicking on non-clickable elements, you can optimize placement of important buttons and links for better usability.
When it comes to the session replay tool, it allows you to see exactly how users interact with your website or game in real-time. This tool captures every click, scroll, and movement made by the user, providing a comprehensive view of their session. With this information, you can:
- Identify pain points: By observing where users encounter difficulties or get stuck on your website or game, you can make improvements to enhance the overall user experience.
- Improve navigation: Session replays allow you to see how users navigate through your website or game, helping you to identify and streamline any confusing or convoluted paths.
- Validate design changes: By comparing session replays before and after implementing design changes, you can determine if the changes have had a positive impact on user behavior.
The main downside to using session replay is the potential for a high volume of data, making it time-consuming to analyze. Using filters and segmentation can help narrow down the data to specific user demographics or behaviors for more targeted analysis.
Additionally, it’s important to have a reliable and secure system in place for collecting and storing this sensitive user data. Without the proper partner or tools, there is a risk of compromising user privacy and violating data protection laws.
Finally, interpretation of this data requires a skilled analyst who can accurately interpret user behavior and translate it into actionable insights for improving the overall user experience. Non-data professionals may struggle to make sense of the data or draw incorrect conclusions, leading to ineffective changes and wasted resources. Therefore, it’s important to have a trained team or partner who can effectively analyze and utilize session replay data for optimal results.
Eye-Tracking Heat Maps For Better User Experience
A level above session replay, eye-tracking heat maps provide a more in-depth analysis of user behavior by tracking and plotting the movement of users’ eyes on the screen. By using specialized software and hardware, such as infrared cameras or sensors attached to monitors, eye-tracking technology allows for precise tracking of where users are looking and for how long.
![]()
How it Works
Eye-tracking heat maps work by measuring the dilation and movement of users’ pupils, which is directly linked to their level of focus and interest. The hotter the color on the heat map, the longer and more intense the user’s focus. This allows for a visual representation of which areas of the screen are receiving the most attention and engagement from users.
Game testers can be especially useful when it comes to eye-tracking heat maps. By observing testers’ eye movements, game developers can gain valuable insights into which areas of the screen are attracting the most attention and adjust their design accordingly.
Benefits for UX Design
Eye-tracking heat maps offer a wealth of benefits for improving user experience design. They provide valuable insights into where users’ attention is focused, allowing for better optimization of important elements such as call-to-action buttons, navigation menus, and content placement. In addition, these heat maps can also reveal any distractions or areas that are hindering user engagement and conversion rates.
Furthermore, eye-tracking heat maps can help identify potential accessibility issues on a website or app. By analyzing users’ eye movements, designers can ensure that important information and elements are easily detectable for users with visual impairments.
Limitations
While eye-tracking technology can provide valuable insights, it also has its limitations. The accuracy of the heat maps relies heavily on the quality of the eye-tracking technology used. Factors such as lighting, head movements, and even glasses can affect the accuracy of results.
In addition, eye-tracking heat maps only provide a visual representation of users’ attention and do not capture the reasoning behind their focus or engagement. For a complete understanding of user behavior, it is important to combine eye-tracking data with other forms of user research.
Data Collection and Analysis From Helika
It can be daunting to sift through a large amount of heatmap data, but with the help of Helika, the process becomes much more manageable. Helika is composed of a professional team of data analysts who specialize in player behavior research. We use advanced algorithms and industry-leading technology to accurately collect and analyze data.
Beyond just providing a visual representation of users’ eye movements, Helika’s heat maps also provide detailed metrics and statistics. This allows designers to have a more comprehensive understanding of how users are interacting with their website or app.
Focus on building amazing games and let Helika take care of the data analysis for you. With our expertise and thorough approach, we can help you make informed design decisions to enhance accessibility and improve overall user experience.
Final Thoughts
From better call-to-action buttons that encourage more revenue generated from in-game items to better level design, his visual data provided by heat maps should not be neglected by UX designers. With that being said, this behavior analytics tool is often difficult to interpret effectively. That’s why working with Helika, a trusted partner in Web3 game analytics and user research, can help ensure accurate data collection and analysis.
If you’re looking for a way to improve user experience and drive more engagement and revenue in your Web3 game, consider implementing services from Helika. With our expertise in data collection, analysis, and interpretation, you can trust that the insights gained will lead to impactful changes for your game. Contact us today to learn more about how we can help you optimize your Web3 game with heat maps and other behavior analytics tools.